
Back to Contents
Reports Generation
Managers of PDR companies in particular may wish to measure business performance on a daily, weekly, annual and other regular periods. This allows managers to make changes if required or to perhaps target specific strengths to extend the business. This can be done using the data that has been entered in whatever software
Some of the more sophisticated software which are specific to the repair industry already have preset report defaults that can quickly generate reports for the manager with the click of one or more commands.
There is a difference in the concepts of reporting and analysis within a business:
| Reporting: The process of organising data into information summaries in order to monitor how different areas of a business are performing. building, configuring, consolidating, organising, formatting, and summarising — that’s reporting. Analysis: The process of exploring the data and reports generated in order to extract useful insights, which can be used to better understand and improve business performance. Analysis focuses on different tasks such as questioning, examining, interpreting, comparing, and confirmingAnalysis focuses on different tasks such as questioning, examining, interpreting, comparing, and confirming
|
For the PDR company or business, although not as sophisticated in most cases, the concept is the same.
Types of Output or Reports
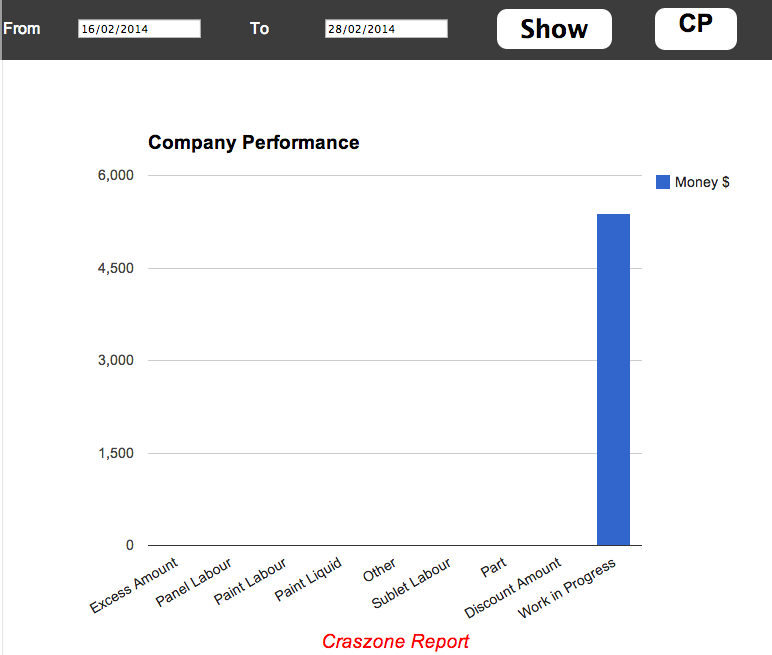
In terms of accounting, types of reports that could be generated from the financial aspects of the software are financial statements, such as profit and loss statements, balance sheets, and variance. From a company perspective, one could also generate basic but still crucial performance data in terms of quotes submitted and actual jobs, quote amount versus job completed, and not paid versus paid invoices. Such a sample was generated out of a job from CrashZone using demonstration data.
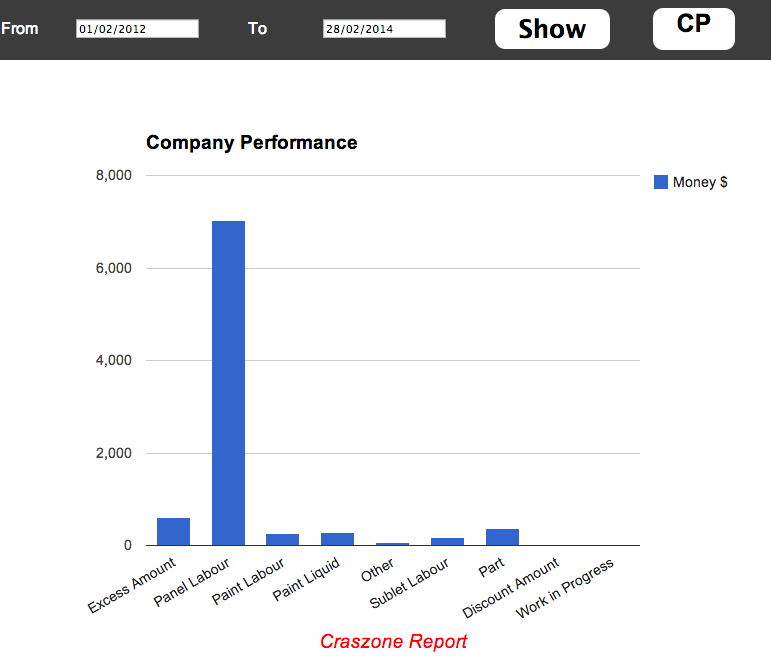
Given sufficient data, company performance would be able to graphed. An example of typical panel shop expenses are provided in the second graphed example. Ideally, a comparison between several variables of a collection of quotes should be graphed.
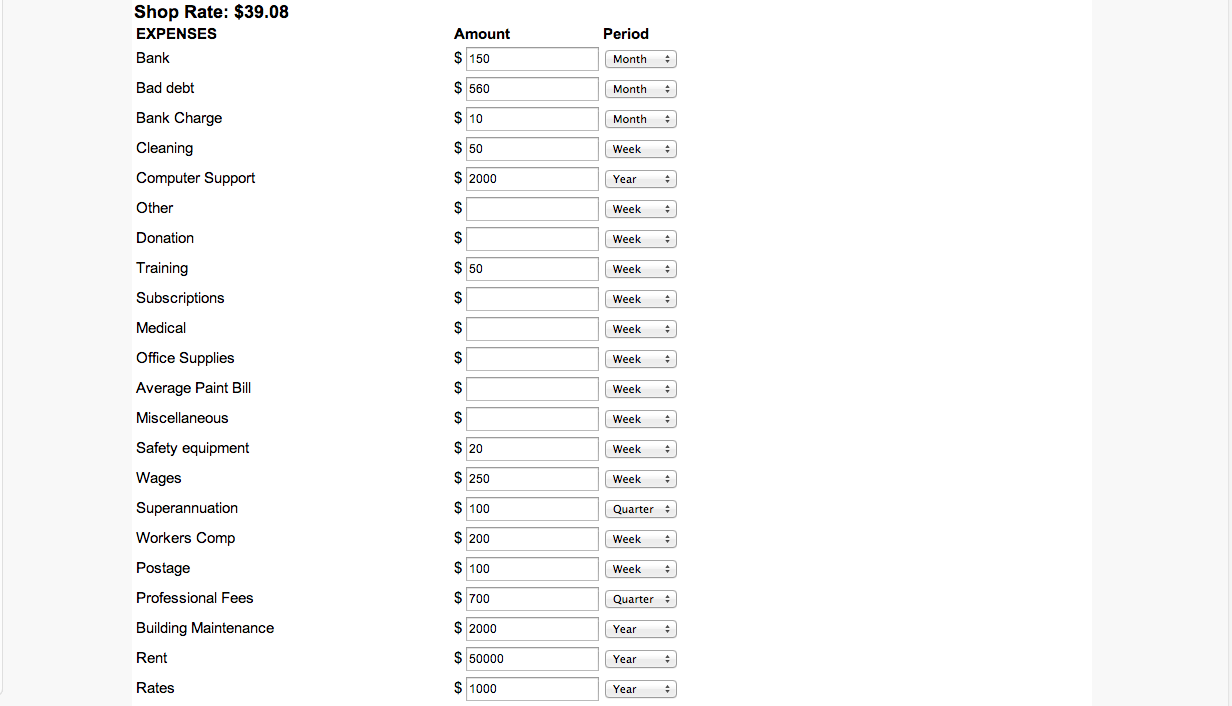
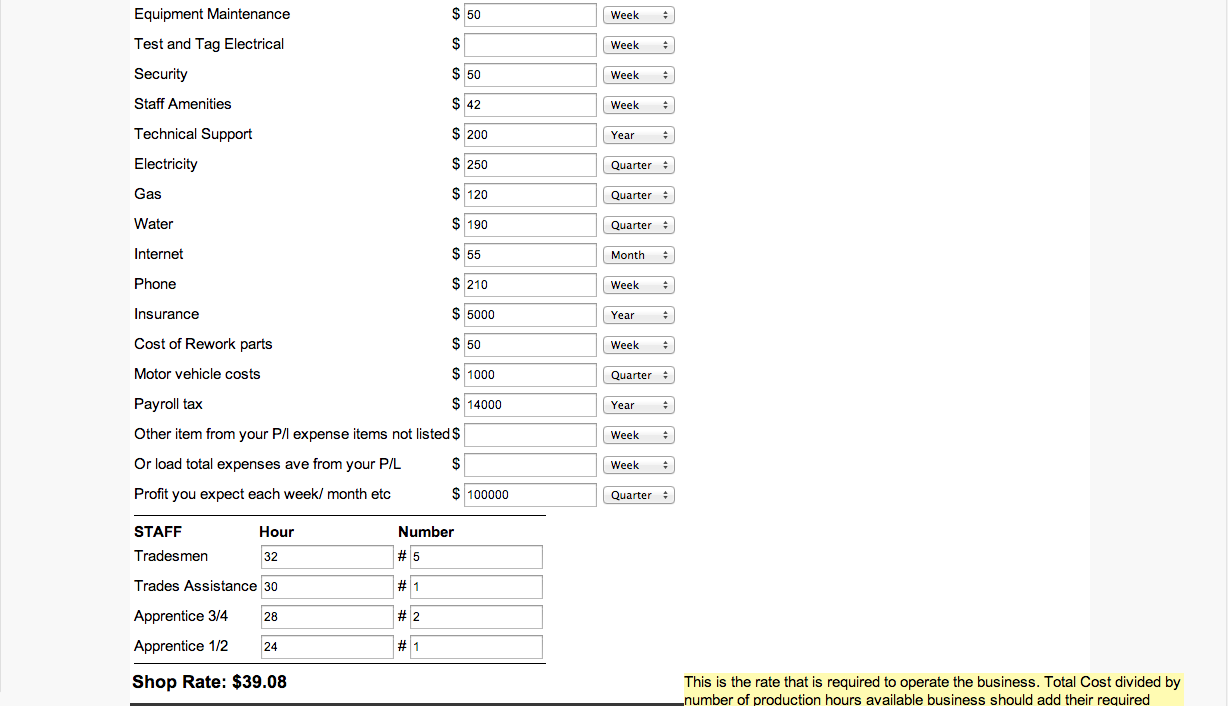
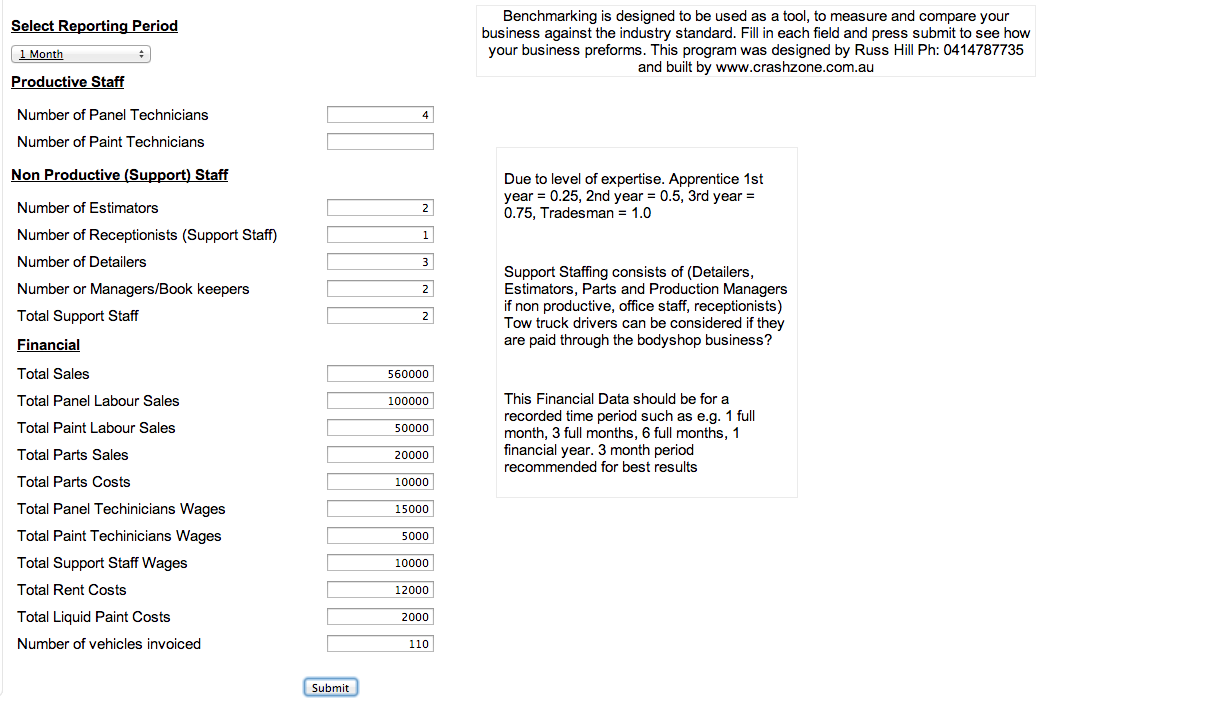
Crashzone has also provided a couple of very useful tools in order to measure shop rates based on the expenses of provided (based on a panel shop). Such expenses could probably be used as some sort of guide for a PDR business remembering though that, hiring of staff are more contractor based so perhaps a per year rather than a per month figure as used in this example would be more appropriate.
One of the tools measures expenses and income profits shop rates more or less like a profit loss relationship.
(Click any of the images for full screen images)
| Shop Rate is shown below |
| Profit Loss (Example) |
 |
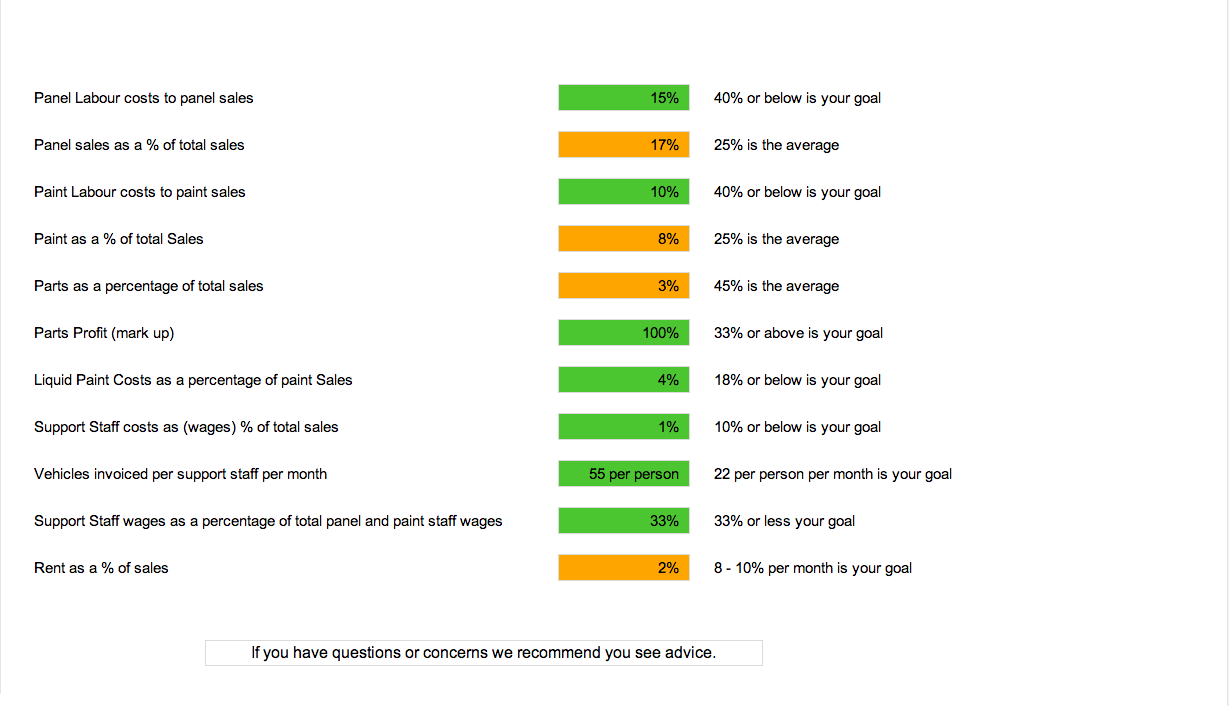
The following example illustrates the comparison between expenses with industry standards – the colour coding represents the comparison above or below the industry standard percentage.
| Company Expenses (example) |
| Comparing Expenses with industry standard expected expenses |
 |
 |
